A “Science” of Investing?
Investment Theory and Practice: a Developing Science
Copyright © 1998 by Jeb Kinnison
1 Background: Terminology and Definitions
1.1 Return: Investment return is the rate at which the value of an investment increases (or, if negative, decreases), denominated in some currency (in the U.S., almost always the US$.)
Inflation-adjusted return: The rate at which the value of an investment increases, adjusted for inflation – when the currency in which returns are being measured is itself losing purchasing power, unadjusted returns can be misleading.
After-tax return: The return adjusted for taxes paid on the investment. Many investors never realized that, for a decade or more in the 70s, their after-tax, inflation-adjusted investment returns were negative.
Risk-adjusted return: Attempts to further adjust returns to reflect the volatility of the value of the investment during the period in question, since it is obviously more desirable to be able to liquidate an investment at any time while still receiving a reasonable return.
1.2 Risk: Risk is the probability that an investment will result in a loss when it is sold or liquidated. If the future value of an investment is seen as a probability cloud of sell points spreading into the future, the risk level is the fraction of the cloud that results in a loss. The current academic definition of risk is that it is synonymous with volatility, since it is easy to come up with mathematical measures of volatility. A correct risk measurement depends on not only the price history of the investment, but also on the probability of adverse events and the sales algorithm of the investor. For example, an unreinforced masonry building located in an earthquake zone and not covered by insurance is a very risky investment, yet by the current academic definition of risk such an investment would be judged low-risk if its market value did not change much over a period.1 This is, of course, nonsensical. The academic definition of risk usually assumes that cash is risk-free, but the possibility of inflation or hyperinflation means that cash, too, has associated risks.
1.3 Volatility: Volatility is a measurement of how widely the market price of an investment fluctuates over time. Oversimplified theories of stock markets start with the assumption that buyers and sellers are moved by a series of events which are stochastic in nature (random and not interdependent). This produces a random walk in market prices that can be characterized and measured. All active markets have this kind of stochastic noise superimposed on their long-term price movements, which are actually determined by investor perceptions of future performance. One consequence of this is that, in the very short term at least, half of all stocks purchased should be expected to fall in price, while half should go up, simply due to market noise.
2 Academic Theories and Styles of Investing
Academic study of investments is relatively new. Only after WW II did significant numbers of economists attempt to understand and characterize stock, bond, and other investment markets; before that, the field was left to investment professionals. Here are some of the theories and styles of investing, and the pitfalls of each:
2.1 Technical Analysis or “Charting”
Since trading of securities began, people have been attempting to graph market prices and other past information to detect patterns which would allow prediction of future prices. These methods have never worked very well, and when a new method does appear to produce unusual returns, it is rapidly copied and becomes nearly useless. Academic studies in recent years have shown that there is almost no correlation, at least for periods of less than a year, between past price information and future prices; apparent patterns are just that. Absent information about the actual buyers and sellers in the marketplace, no useful information about near-term future prices of an issue can be gleaned from looking at past prices. 2 The work that discredited technical analysis led to the Efficient Markets Hypothesis.
2.2 The Efficient Markets Hypothesis (EMH)
Academic researchers in the 60s discovered that “Brownian motion” explained most of the short-term price fluctuations of stocks. They went on to explore the hypothesis that markets are efficient in the sense that useful information about an equity is rapidly transmitted and absorbed by a large community of knowledgeable, rational investors, so stocks are normally selling at about the prices they “should” be. Starting from that outlook, they further hypothesized that risk is equivalent to volatility, and that rational investors would accept greater risk only for greater rewards in the long term. Volatility could be mathematically characterized by a measure called beta, which roughly speaking indicated how far a stock would on average deviate from the price of the market as a whole by random walk in a certain period. This is now known as the “semi-strong form” of the EMH (the weak form only indicates that future movements of stock prices cannot be determined from past movements, and is not seriously questioned, at least in the short term). Studies done in this period confirmed that prices for equities did rapidly adjust to news about earnings information and stock splits, and to a great extent anticipated such news, demonstrating that knowledgeable investors were aware of the content of much news before it was actually released.3 Another study appeared to demonstrate that portfolios with higher betas (more volatility) produced better returns.4 A popularized version of the EMH work by Prof. Burton Malkiel of Princeton, A Random Walk Down Wall Street, became a best seller. Since Prof. Malkiel now runs a fund and picks stocks, it is apparent that the semi-strong form of EMH has been questioned in the years since, but the new thinking did lead to the phenomenon of indexing (creating portfolios designed to represent the “average stock” without regard to each issue’s prospects) – after all, if most stocks are fairly priced and no amount of technical or fundamental analysis could improve upon buying a basket of stocks at random, why pay analysts? In the twenty years since, studies have demonstrated that the semi-strong form of the EMH is flawed. Price response to some items of news continues for days or weeks.5 Individual issues move 20% or more in a day on news that was already well known to analysts. Prices often spike during a presentation at an investment manager’s conference as large numbers of investors are simultaneously exposed to a positive presentation, then decline to their previous levels. Performance of recent IPOs as a group has been demonstrated to be less than market, something that could not happen if the EMH held; in fact, it is easy to construct portfolios which underperform the market.6 Every market mania or bubble in the past demonstrated that markets could be irrationally overvalued for long periods, then collapse.7 Careful studies by the originators of EMH demonstrated that there was no relationship between beta and return, meaning that investments that were characterized as more volatile did not necessarily come with a compensating reward.8 And EMH supporters themselves realized there was a logical flaw which could not be refuted: if large numbers of investors followed EMH and stopped doing research, the efficiency of the market would necessarily decrease, because an efficient market could only be maintained by the vigilance of active managers and analysts. It became clear that the market was only approximately efficient, and the more specialized the issue and the fewer analysts and investors studying it at any time, the less efficient its pricing might be; the marketplace is a complex system which is full of feedback loops that keep it just inefficient enough to make profitable an ever-shifting search for inefficiencies. Moreover, certain systematic inefficiencies appear to be permanent and are perhaps due to basic flaws in the commonsense decisionmaking mechanisms of the human brain, or in the incentive structure of the investment industry. The assumptions of the EMH (patient, rational investors, efficient transfer of information, reward related to risk taken) appear increasingly questionable. The boundaries of these inefficiencies can be seen in the well-known phenomenon of regression to the mean as portfolio managers move up the size of their assets under management. Managers who have the ability to produce greater-than-market returns have discovered that it is much harder to do so running larger amounts of money, because they themselves affect the market, and as their success becomes widely known their actions are copied by the brokers they use to execute trades. “Manager X is buying Y!” goes out on the gossip trees, and Manager X discovers his targets have risen in price before purchase is completed.
2.3 Momentum Investing
Technical analysts believe trends in prices, once established, tend to continue. The same belief led to momentum investing, which suggests that stocks which have outperformed the market in earnings or price in the recent past are more likely to continue to do so than not. Like every other style, momentum investing can appear to work for some time, especially when the market as a whole is rising and the amount of money being made available to momentum–oriented investment managers is rising. Momentum managers can post astonishing return numbers but tend to be caught in crashes as their overvalued holdings collapse; every generation has had at least one such momentum fad and collapse which discredited the style. When the market is doing well and most investors no longer remember the past, momentum managers float to public prominence again, as they have in recent years. Academic evidence suggests that momentum does have some value in the short term, but there now appear to be so many managers pursuing the strategy that its profitability is questionable, and “momentum” funds have underperformed the market this year.
2.4 Fundamental Analysis or “Value Investing”
This style supposes that, by analyzing the financial data (balance sheets, inventory levels, past growth rates, etc.) about a company, a current valuation for the claim on the company’s future earnings represented by its stock or bonds can be calculated. When that valuation is substantially above the market price of the issue, the issue should be a good investment. Over period longer than a few years, issues that are undervalued by simple fundamental measures like PE ratios and book values do tend to outperform the market.9 Most of the successful long-term investors known to the public have followed this school of thought, including Warren Buffett, and Graham and Dodd. However, many managers using this style underperform the market for long periods, perhaps because they fail correctly account for intangibles like quality of management and strategic market positioning, and so end up buying many declining companies in declining industries that appear by the numbers to be cheap; investors like Mr. Buffett, on the other hand, think of themselves as buying good businesses at low prices, and carefully evaluate management quality and long-term health of the business before investing. Value-oriented managers also run into problems with their customers when they implement strategies contrary to the fashions of the day and underperform the market for periods; it is common for a value-oriented manager to lose clients (and assets under management) during these periods of underperformance, so the client’s biases still produce net selling of undervalued assets despite the manager’s value orientation. It is also important to recognize that accounting practices are not the same between companies, industries, or countries10, and that the simplest measures of value, like price/earnings ratios and book values, often fail for industries with large components of intellectual property, economies of scale, or monopolistic aspects. However, fundamental value measures often indicate the lowest price a stock will reach in a market downturn, and can be used to decide when it is a good time to buy a particular issue that is out of favor.
2.5 Fundamental Analysis Today: Co-opted by the Marketing and Sales Machine
Modern financial analysts have attempted to create more sophisticated measures of value taking into account more intangible factors and projected growth rates. An entire ecology of analysts, managers, funds, advisors, and media has developed to create and transmit research information; unfortunately most of this research is systematically distorted by the incentives seen by each participant, making most of this research worse than useless. “Free” research and advice should always be assumed to be propaganda. There are two main types of analyst working in the industry, sell-side analysts and buy-side analysts. Buy-side analysts work for major investors like institutions and mutual funds, and usually keep their work secret. Sell-side analysts work for large brokerage houses and investment banks, and often go public with their analyses. The well-known analysts whose comments are widely reported in the media are typically sell-side; they make their work public because it assists in the sales of client company issues and can itself move markets. Sell-side analyst reports are usually transmitted to favored customers first, smaller customers second, and last to the public, allowing favored customers to buy first and sell at a profit to the public.11 Studies have shown that even the most esteemed analyst recommendations are contrary indicators (that is, a basket of highly recommended stocks tends to underperform the market over time)12 and that their earnings estimates are usually much too optimistic. It is not at all unusual for analysts to project company revenue growth rates which, aggregated over a sector, are much higher than industry sector growth rates – all of their children are above average! One study showed that, between 1982 and 1997, analysts overestimated the growth of earnings of companies in the S&P 500 by an aggregate 188%, with actual annual growth coming in at 7.8%, while the aggregate analyst estimate at the beginning of each year was 21.9%.13 Analysts’ average estimates, appropriately discounted for their biases, are now commonly used as a guide to future earnings, but much more useful is the change in analysts’ estimates – analysts are naturally loath to decrease estimates a large amount at one time because it makes their earlier estimates look like more serious mistakes, so a trend toward downward estimates does tend to continue for some time as analysts capitulate grudgingly to reality and can be one of the more useful sell signals, at least for smaller stocks which are not widely followed and traded by institutions. This is why announcements of apparently small downward estimate revisions by respected analysts often have a disproportionate impact on an issue’s price.
2.6 Market Timers and Asset Allocators
Some analysts study the macro economy and all of the previously discussed methods to advise clients on when to buy and sell equity markets as a whole. Periodically one or more of these analysts successfully calls a market turn several times in a row and develops a public following. If eighty analysts make 3 calls and have a 50% chance of being right each time, ten of them will likely prove to have been correct all three times, and can advertise this fact to a gullible public.14 This is one of the reasons for the current shibboleth “Market timing doesn’t work,” which needs to be drummed into the heads of most investors. Studies of individual investor behavior show that most individuals who try to trade in and out of the market are acting on the fallacious belief that the recent trend will continue, and so tend to be depressed about the market and scared into selling at low prices, and lured into buying at high prices when headlines are trumpeting new highs and all their friends are talking about an investment sector.15 Most analysts who offer advice on trading in and out of the stock market as a whole do no better than chance, and often worse. There is ample evidence, however, that systematic strategies which reduce allocations to equities when they are unusually expensive by fundamental measures and increase them when they are low-priced by the same measures can improve long-term performance. 16 Asset Allocation strategies17 rely on the fact that portfolios which are distributed between bonds, stocks, and a variety of other assets tend to be less volatile, though giving up some of the gains from long-term investing in equities alone. This is advantageous for the investor who may need access to some or all of the portfolio’s value at an unknown time in the future, and partially protects the portfolio’s paper value during a long decline in the value of one asset class, as occurred with both stocks and bonds in the 70s. For investors with very long time horizons (such as pension funds or charitable institutions), asset allocations should be heavily weighted toward equities, because over periods longer than 20 years, equities always outperform all other asset classes.18 Asset allocation has been taken up and “productized” by the full-service brokers and mutual fund industry, who now sell managed portfolios with asset allocations that are set by their analysts. The Wall Street Journal keeps track of the full-service brokers’ recommended allocations, which tend to be similar (see 2.9, The Thundering Herds), and prints their quarterly returns, which also tend to be similar, and generally are statistically indistinguishable over the long run from a “robot allocation” strategy of fixed proportions rebalanced at fixed intervals.19 The brokerages and mutual funds, then, are simply offering market timing services at the margins when they change their asset allocations, with no notable advantage to the investor, and at the cost of high fees. The robotic scheme tends to sell an asset class after it has outperformed the other asset classes in the portfolio, and buy it when it has underperformed, a mechanism that tends to be contrarian and over the long run has performed better than holding a fixed portfolio. The standard sales pitch from the brokers usually mentions studies that show that “nearly 92% of the variation in pension funds’ returns were attributable to the asset allocation decision.”20 They fail to explain what this means, but do point out that they offer this very important service. A Fortune magazine article21 points out that this item of conventional wisdom is supported by studies done in 1986 which demonstrated that portfolio managers’ returns over the periods studied were determined mostly by how much of their portfolios were invested in stocks, not which stocks, bonds, or other assets they purchased. In other words, the study actually demonstrates that an investor’s willingness to accept short-term enterprise risk by investing larger portions of a portfolio in equities was rewarded with higher long-term performance, and the actual equities chosen and timing did not matter nearly as much! The studies did not suggest that “professional portfolio allocation services” of the type offered by brokers and mutual funds were critical to performance, yet they are constantly cited in sales material.
2.7 Modern Portfolio Theory (MPT)
Modern Portfolio Theory was first outlined by Dr. Harry Markowitz in his Ph.D. thesis in 1952, for which he later received the Nobel Prize in Economics. MPT takes off from the EMH, making similar assumptions about risk (defined as volatility). Past price records for the available components of a portfolio were crunched against all the other components of the portfolio and market indices, which allowed construction of a matrix of covariances. By choosing among components with low covariances, a portfolio that maximized return with minimum volatility could be constructed. At the time computer power was scarce, so this method was simplified by Sharpe et. al. to produce the Capital Asset Pricing Model (CAPM), which split the risk calculation into one measure of market risk, beta, which indicated how much the stock’s price was affected by movements of the market as a whole (i.e., a stock with a beta of 2 would be expected to move up or down twice as much on a percentage basis as the market as a whole moved in a period), and a measure of risk specific to the stock, alpha, which indicated how volatile the stock was independent of the market generally. Alphas were presumed to be independent of each other (a risky assumption) and relatively stable (another risky assumption). The many assumptions underlying these theoretical portfolio construction tools are outlined in Contrarian Investment Strategies: The Next Generation, by David Dremen, Appendix A. Portfolios built on CAPM or MPT have proven over time to perform no better than the market as a whole. Though the risk-management thinking behind MPT is a valuable tool to minimize volatility in portfolios, it appears that it is no more effective than any other number-crunching-of-past-price-data procedure in improving long-term performance or minimizing long-term risks. Covariances and volatility vary widely over time.22 A better risk-management algorithm would identify the underlying events that create large movements in asset prices, then calculate the sensitivity of an entire portfolio to each such event, and use an estimate of the time distribution behavior of each event type to minimize total portfolio risk. Unfortunately, there is no simple procedure to find and determine the probability of occurrence of the most catastrophic events or their impacts on asset prices.
2.8 Contrarian Investing and the Psychology of Investors
Contrarian investing strategies observe that, while the EMH is a reasonable approximation in many markets much of the time, it is clear that defects in the short-hand logic used by investors to make decisions lead to inefficient markets in certain sectors at certain times. The most popular investment ideas of one period tend to underperform in succeeding periods, and conversely, out-of-favor investments tend to outperform. Investors tend to buy what they have heard the most about, leading to short-term price spikes when a stock is advertised via the media, long-term price bubbles when a mania has a large segment of the population discussing and investing in a supposed “sure thing,” and increasing the prices of stocks which are being “sold” to investors by the investment banking community above levels they would otherwise reach. The contrarian attempts to do the opposite of what the crowd is doing, buying ignored, unadvertised, and undervalued assets cheap, and selling overvalued and popular assets when their prices are high. Being profitably contrarian requires some characteristics not natural to a well-adjusted human being: acting against what most respected authorities are advising at the time, avoiding the investments that have done so well for your peers, and the ability to be objective during periods of high emotion which create irrational panic selling or buying. Contrarian investing techniques and the fascinating subject of how common-sense reasoning, so useful in daily life, leads to poor investment decisions by the majority of investment managers as well as small investors are well-covered in David Dremen’s terrific book, Contrarian Investment Strategies: The Next Generation, Simon and Schuster, 1998.
2.9 The Thundering Herd: Population Dynamics of Memes in the Marketplace
In 1990, we designed an “artificial life” testbed which allowed simulation of large populations of trading “organisms” which were allowed to breed (and pass on their trading “genes”) only to the degree their trading activities were more profitable than their peers’. After thousands of generations, market charts produced by these simulations showed a great resemblance to long-term charts of actual markets, complete with long-term uptrends and precipitous collapses or “panics.” Populations of trading organisms using a particular strategy tended to rise slowly until their success produced an overpopulation, the overpopulation led to extreme market prices because of the large number of organisms simultaneously executing the strategy, followed by a market swing that made their strategy unprofitable, which dramatically reduced their population in the next generation and caused the character of the market to change as other strategies became more popular. Meanwhile, populations using neglected trading strategies which had survived began to expand as their old strategies, which had been producing such low returns that they were unable to compete for space or resources with the currently successful trading population, abruptly became more profitable. The interaction between populations of ideas about when to buy or sell, or trading memes,23 produced characteristic boom and bust cycles and price fluctuations quite independent of the underlying assets being traded (which, in the simulation, paid a constant dividend, rather like perpetual bonds). This, we think, is the primary reason why contrarian thinking is so important to successful long-term investment. The population of human beings empowered to make large investment decisions is relatively small, and most of them operate as part of a system that has evolved over time to extract investment fees from customers. Customers come and go, but the firms which employ investment managers know that the key to survival and prosperity is to never dramatically underperform the other firms their customers could easily move to. This implies that, from a hired investment manager’s perspective, staying with the herd is more important to survival than producing high long-term returns, for large asset management firms tend to be eager to fire investment managers who underperform.24 Because the business of retail investment management is more about marketing and sales of mediocre (or worse) products than it is about giving people portfolios that help them reach their goals and provide good long-term returns, incentives to investment managers to stray from the herd are smaller than one might expect, and disincentives large. No manager, after all, gets fired for failing to anticipate a correction in the broad market or buying the S&P 500 to mimic the performance of the index, but many get fired for underperforming the market for even short periods. That is one reason why the few managers who are free to use contrarian and value-based strategies (e.g., Warren Buffett) are able to outperform the market over long periods of time – they do not find themselves abandoned by customers or management when quarterly or yearly performance is sub-market, and they are free to implement strategies which carefully screen for value criteria and go against the herd piling into crowd-favorite asset classes and stocks. Meanwhile, the herd drives prices of favorites up, producing excellent short-term returns, until the divergence in valuations between the favorites and alternative investments becomes large enough to produce an abrupt correction, which can cause a dramatic change in investor psychology and the strategies of investment managers. Eighteen years ago, US equity prices were, by fundamental measures, very cheap after 12 years of negative after-tax, inflation-adjusted returns. Magazines discussed the “death of equities” as an investment and much of the population was immersed in speculation in real estate, gold, commodities, and collectibles. Brokerage salesmen sold investors tens of billions of dollars in energy and real estate partnership units, most of which were worth fractions of their purchase price a decade later. Today, large-cap US equities are, by fundamental measures, 20-40% overvalued, and well above the long-term trendline of GDP growth discussed later in 3. Stocks for the Long Run. Waves of speculation push some sectors up far beyond sustainable levels, then collapse. The public has more of its wealth in US equities than has ever been the case in the past.25 Party conversation often centers around stock and mutual fund investments, clever speculations, and the prospects for early retirement on market gains. The market climate is similar to the mid-60s, when go-go fund managers followed momentum to handsome returns, analysts discarded fundamental valuation yardsticks to buy the “Nifty 50” (50 large-cap growth stocks that everyone agreed had futures of unlimited growth26), and wary portfolio managers who tried to avoid overvalued assets were swept away by investors who expected 20%+ yearly returns. This market climate lasted years, punctuated by sharp corrections, and only ended when inflation and economic stagnation led to a decade-long bear market. Contrarians and fundamentalists agree that the probability of continuation of the high returns of the last 18 years in the US equity market is not high, at least for the next decade. No one can predict when or why the climate will change, but change it will.
3 Stocks for the Long Run
3.1 A 200-year record of better performance?
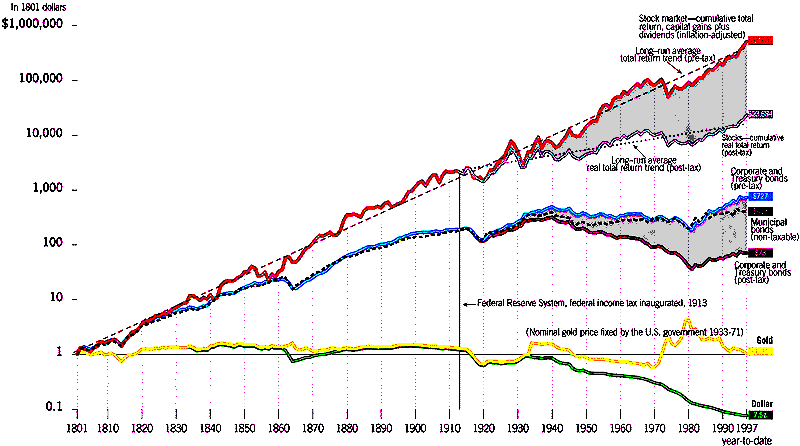
Prof. Jeremy J. Siegel of the Wharton School of Finance examined the historical performance of stocks and bonds in the US from 1802 to 1992 in his excellent book, Stocks for the Long Run: A Guide to Selecting Markets for Long-Term Growth (1994, Irwin Professional Publishing). This work, updated to 1997 27, demonstrated that the long-term rate of return for US equities, adjusted for inflation but not for taxes, was a relatively constant 6.6% during the entire period studied, although the market could under- or out-perform this base rate for periods as long as 20 years. The other asset classes examined were not even close. Long-term Performance By Asset Class: US 1801-1997 (from Forbes, 7/28/97).
3.2 Global Stocks for the Long Run?
Prof. Siegel also examined in detail the same asset classes in three large foreign markets with long histories: the UK, Germany, and Japan. For the period from 1927 to 1992, real returns on equities in the UK averaged 5.7%, and in Germany, despite the destruction of WW II, 5.4%. UK bonds returned somewhat less than US bonds, but German bonds were wiped out by the hyperinflation of the early 20s and an active German bond market did not exist through WW II. In Japan, prewar investors in bonds were wiped out by postwar inflation, while equity investors suffered a 98% loss in value during the war but more than recovered when the Japanese stock market went on to outpace all world markets from 1948 to the crash in 1989, rising 20 times more than US markets. The lesson is that even in times of war and complete devastation, stocks were less risky in the long run than bonds, the value of which can be completely destroyed by inflation. While German and Japanese stock markets suffered during the inflationary crises in both countries, in both cases investors who held on recovered much of their investment in a decade. Good data on many emerging markets is available only from about 1970, which Prof. Siegel points out is not long enough to draw similar conclusions. What data is available does tend to support the hypothesis that equity markets in all pluralistically-governed, stable countries outperform local currency bond markets, and that they are likely to have a characteristic rate of return over the long run that varies somewhat from market to market based on the cultural, legal and tax system of each market. The most careful recent study of 21 foreign equity markets with histories going back to the 20s found that a GDP-weighted index of these markets lagged the US market by only 0.28% a year despite the inclusion of markets dramatically affected by war and political instability.28 Emerging markets with democratizing political systems and improving access to global markets, techniques, and equipment may offer even better long-term returns, at the cost of increased volatility.29 Foreign markets are useful as additional asset classes for diversification. In recent years, cross-correlation between US and major foreign equity markets has hovered around 0.5. While it appears that foreign and US markets are becoming more closely correlated in the short term as globalization continues, it should continue to be good practice to use a variety of foreign equity markets as separate asset classes in asset allocation and rebalancing schemes; to the degree that they are not correlated with the US market, their inclusion should result in better returns with lower total volatility.30
3.3 The implications of the record
We’ve seen that chart-reading and trend-following methods were decisively refuted by academic studies showing that, in the immortal words from countless pieces of marketing material approved by the SEC, “Past performance does not guarantee future returns,” that is, price performance of the recent past has no correlation with near-term future performance. Yet Siegel and others demonstrate that, over the very long term, returns in all mature equity markets are larger than local currency bond returns (barring war or instability), and it appears that investors using fundamental valuation guidelines and changing equity weightings so as to underweight equities when they were substantially below the long-term trendline and overweight them when above could have successfully “timed the market” over a period of 200 years, increasing their long-term return above that of equities alone. Is there an inconsistency? After all, we’ve seen that “market timing doesn’t work.” There is no inconsistency because the time scales are quite different. It appears that in the very short term (hours to weeks) prices are dominated by noise and information flow; in the short term (weeks to months) by sentiment and fundamental news; in the mid-term (months to years) by earnings growth rates and other indicators of value and macroeconomic trends, as well as competition from other asset classes like bonds; and in the long term (decades) by an underlying growth pattern that represents the true return for taking on the enterprise risk associated with equities. Market timing does not work on timescales of less than years (when investors most want to use it!), but apparently can work in the long term (which is beyond the timescale for reward targeted by either investment managers or most of the public).
3.4 The Trouble with Indexing
Most investors are entirely ignorant of how the well-known market averages or indices are constructed. The Dow Jones Industrial Average, for example, was originally a simple average of 12 industrial stock prices; as time passed, the original 12 stocks split, reorganized, went bankrupt and were replaced, etc., until now the average contains 30 stocks with bewildering weightings that have little to do with the revenues or the capitalization of each issue. The DJI still serves a purpose as a shorthand indication of how the market is doing, but it is not representative of the market as a whole. The original DJI was an unweighted index, giving all included issues equivalent weight; that is, the change in price of a small company influences the index as much as change in price of the largest companies. This, of course, is quite a bit more biased than a capitalization-weighted index; buying an index fund based on such an index would tend to overconcentrate assets in the smallest issues. A more modern index, the S&P 500, consists of 500 stocks selected by a committee (generally stocks which have had the highest capitalizations for the years previous).31 They are averaged according to capitalization; that is, shares outstanding times current price. This method is better than the ad hoc method used to calculate the DJI, but still systematically distorts the averages; an index fund based on the S&P 500 tends to invest a large fraction of its assets in companies with high stock prices, regardless of the underlying cash flows available to the company. In other words, the index overrepresents current herd favorites and underrepresents out-of-favor stocks. The trend toward indexing (buying baskets of equities based on an index) was based on the EMH. It appeared that if the EMH was correct, there was no point in trying to pick and choose among issues, because all issues were priced fairly, and an investor could save the expense of research and management by simply “buying the market.” The trouble with this is that the EMH is flawed, and that unwise choice of index could easily mean investors were unknowingly buying only a biased sample of the market. Compounding this, money managers started to be graded and compensated by their performance against the S&P 500, which meant that the rational risk-management response of the manager was to buy the S&P 500 for a large portion of the portfolio, and to put in effort only around the margins to add value. By the time academic research had demonstrated the flaws in the EMH and the unrepresentative nature of capitalization-weighted indices, these trends were firmly established. When the announcement is made that a stock is to be added to the S&P 500, it typically jumps in price by a few percent; and there is no way to know how much the price had rationally risen before that on anticipation of its addition, the criteria for addition being fairly predictable. Therefore an investor buying the S&P 500 is, in some sense, paying more for that privilege because of the additional demand by index funds and managers for an S&P 500 weighting. As long as S&P 500 indexing continues to claim an increasing share of invested funds, as it has for two decades, the S&P 500 should continue to outperform broader market indices, all other things being equal; but if the trend toward indexing should halt or reverse, it is quite possible S&P 500–based index funds would underperform for a similar period. The Russell 3000 index32 and the Wilshire 5000 Index are a major improvements over the S&P 500 in that, while they are still capitalization-weighted, they include the 3,000 and c. 8,000 33, respectively, highest-capitalization stocks, period. There is no committee which decides whether a stock is “ready” to be added, and therefore somewhat less bias toward institutional favorites. The ideal weighting for an index designed to capture an unbiased cross-section of a market is still a research problem. Weighting by some combination of revenue, book value, and other fundamental measures would produce a “Value Index,” but this would amount to a managed portfolio! The good thing about capitalization-weighted indices is that they are easy to calculate, and represent (flawed though it may be) the current market consensus on each company’s importance to the market.
3.5 Indexing the World?
How would one go about allocating the equity portion of a portfolio amongst the wide variety of world equity markets? Most global funds simply try to time markets, changing weightings between markets as events seem to dictate. Then there are capitalization-weighted efforts, which again suffer the flaw of overweighting markets with very high valuations and underweighting cheap markets, precisely the opposite of what should be desired.34 One fund has a partial solution: The Kent International Growth Fund is attempting to overweight markets where market capitalization is an unusually small fraction of GDP, and underweight markets where capitalization is unusually high relative to GDP. While there are problems to this approach (it tends to underweight high-growth regions, for example, and does not take into account varying national accounting and debt-financing practices), the five-year performance record of the fund is a percent or two ahead of similar global funds based on capitalization-weighted indices alone.35 A better algorithm would be to chart the long-term performance of each country’s market to discover, as for the US market, its current level with respect to its long-term trend line and GDP level. Markets that are markedly above their historical trend lines and expensive by fundamental measures like PE, PEG36, and book values, appropriately adjusted for local accounting standards, would be underweighted; markets below their historical trendlines and inexpensive by these same standards would be overweighted. And of course markets in countries where pluralistic government is nonexistent, war appears imminent, or economic stability is eroding would be avoided entirely, with extra points for markets with long histories of stable democratic government and well-managed currencies. This algorithm should perform somewhat better in the long run than the “robot rebalancer,” but shares its characteristic of automatically buying an asset class when it is cheaper and selling it when it is more expensive than other asset classes. The details of the weighting criteria are probably not critical, since the goal is to avoid certain pathological flaws of the indexing-by-capitalization approach37, not to achieve perfect market timing, which is not possible.
3.6 Other Asset Classes for the Long Run?
What about cash, bonds, commodities, gold, and real estate? The historical record shows that most alternative asset classes dramatically underperform equities for the long run. How much of each should be included in an asset allocation?
3.6.1 Cash
A small allocation of cash is normally included in every portfolio to provide liquidity. In theory, events could conspire to make a sale of other assets difficult or disadvantageous at the moment the cash is needed. But in practice, any cash allocation above the minimum necessary for emergency needs (a conservative standard being six months of income, or three months of household expenses, whichever is less) reduces long-term performance. Volatility is reduced, but at a high cost.
3.6.2 Bonds
Bonds are certain losers in the long term. The historical record shows that bonds are the asset most likely to become completely worthless in the long run, usually because of hyperinflation. The one circumstance allowing bonds to outperform other assets is deflation and economic contraction, as occurred in the US during the Depression, and in Japan in the 90s. Bonds can not only hold their value under such circumstances (so long as their issuers remain solvent), but appreciate dramatically compared to equities. So bonds do have a place in every portfolio as insurance against this rare event, but like all insurance, it comes at a high price; historically, bond performance has been poor, and at a risk of loss higher than most realize (the US has enjoyed a rare continuity of good economic and government management over most of its history, but most countries have not been so fortunate – in extremis, all governments will risk hyperinflation rather than lose a war; even the US did so during the Revolutionary War, when the national currency became nearly worthless.38) So bond allocations should be limited to what is needed to supplement other income for up to a decade of Depression-like conditions, or, for investors with possible near-term needs, an amount sufficient to reduce portfolio volatility to tolerable levels.
3.6.3 “Junk” Bonds
“Junk” bonds are corporate bonds backed by issuers who are not credit-worthy, or are issued in large amounts or subordinated to other debt so that it is clear the company could not pay the interest on the issue if business did not go well. They naturally pay higher rates of interest than quality bonds, but are extremely volatile; like equities, they tend to go worthless when a company goes bankrupt, and like equities, they can appreciate dramatically when the issuer does well. Investing in junk bonds is highly specialized, since the detailed terms of the bond determine their fate in bankruptcy or reorganization.
3.6.4 Convertibles
Convertibles are bonds or preferred stocks that can be converted to common stock at a certain price under certain conditions. They normally pay a higher (and more protected) dividend rate than the common, though less than a bond would, but they can also participate in common stock appreciation through conversion. They are a conservative cross between stocks and bonds. Since, like junk bonds, their detailed terms are critical to analysis, investing in convertibles is best left to a specialized manager. We have seen no studies of the long-term performance record for convertibles, but it would be expected to be midway between equities and bonds.
3.6.5 Real Estate
Most people already have a substantial investment in real estate in the form of their home. Many common real estate investments, like bare land, time shares, and rental homes and condominiums, have very poor performance records and impractical management overhead for the average investor. Real estate limited partnerships have net lost money for investors until quite recently, probably because of inherent conflicts of interest between general and limited partners; publicly-traded REITs (Real Estate Investment Trusts) have a better record, outperforming equities over the period 1973-1994, with a compound annual return of 13% and cross-correlation of 0.5-0.8. 39 As with equities, global real estate exposure should be sought for diversity. Income-generating equity REITs are one of the few asset classes that perform well during inflationary episodes, especially when leveraged, and should be a component of all portfolios where a home is not already a significant asset. Their performance record is not long enough to conclude that they have long-term performance characteristics similar to equities, but the evidence is pointing that way.
3.7 Gold, Oil, Commodities, Collectibles…
During the 70s, inflation made “tangible” assets the investment of choice. Even after inflation, these assets performed well during that decade. However, historically they have not done well, since they generate no income or growth; they do well only when the value of cash itself is declining and fear of inflation drives investors to them. The same protection against possible inflationary episodes can be had, with better long-term performance, by adding real estate, natural resource, and energy production equities as separate classes in an asset allocation plan, since all have done well during inflationary episodes and also have the benefits of equities (dividend income and potential growth).
Footnotes
1 Taken to an extreme, such a building would normally sell for the value of the land plus the net present value of the future rents. Supposing that an earthquake large enough to destroy the building has a 50% chance of happening every year and that the land value was negligible, the building would sell for a little bit less than one year of rent. So long as no earthquake occurred, the value of the building would not fluctuate at all (assuming that earthquakes are stochastic events, which is not quite true). Yet after purchase the investor would run a large risk that the building would be destroyed long before its rents could return his purchase price, accompanied by the possible reward of a longer-than-expected period of rent collection if the quake does not occur in the first year. This building would be a good investment if the purchase price were significantly less than a year’s rent, yet it would still be a risky investment.
2 Eugene F. Fama, “Efficient Capital Markets: II,” Journal of Finance 46 (December 1991), pp. 1575-1617.
3 Eugene F. Fama, Lawrence Fisher, Michael Jensen, and Richard Roll, “The Adjustments of Stock Prices to New Information,” International Economic Review 10 (February, 1969), pp. 1-21; Ray Ball and Phillip Brown, “An Empirical Evaluation of Accounting Income Numbers,” Journal of Accounting Research 6 (Fall, 1968), pp. 159-178.
4 Eugene Fama and James MacBeth, “Risk, Return, and Equilibrium: Empirical Tests,” Journal of Political Economy 81 (1973), pp. 607-636.
5 Eugene F. Fama, “Efficient Capital Markets: II,” Journal of Finance 46 (December 1991), pp. 1575-1617.
6 For example, a portfolio made up of stocks most recommended by sell-side analysts, or a portfolio of the highest PE ratio stocks.
7 Charles Mackay, Extraordinary Popular Delusions and the Madness of Crowds, The Noonday Press, 1991. Also see Chapt. 16, “The Zany World of Rationality,” in David Dremen’s Contrarian Investment Strategies.
8 Eugene Fama and Kenneth French, “The Cross-Section of Expected Stock Returns,” Journal of Finance 67 (1992), pp. 427-465.
9 Ibid.
10 For example, in the US, GAAP (Generally Accepted Accounting Principles) allow R&D expenses of many types to be expensed rather than capitalized. Companies in high tech sectors often report low earnings while spending more than 10% of revenues on R&D, which, if it is effectively conducted and returns more than its cost in future profits, means these companies will consistently appear to be less profitable than they are. Countries with high corporate tax rates tend to have accounting practices that understate profits, and in emerging markets, accounting standards tend to be lax, making reliance on fundamental value measures treacherous.
11 Being the favored recipient of a research report before it is released to other investors is known as having “first call.” Our observation is that analysis of transmission of information (and propaganda) within the marketplace is the only type of analysis which can result in consistently profitable short-term trading.
12 “The Superstar Analysts,” Financial World, November 1980, p. 16. Such analysts are now paid six and even seven figure salaries, topping those of many CEOs. Clearly, it is not because of the great performance of their recommendations.
13 Forbes, January 26, 1998
14 The same effect is seen when mutual fund families set up large numbers of in-house funds, then open up to the public (and advertise the records of) only those which have market-beating records for their first few years. The public believes the managers of these “outperformers” can beat the market. The subsequent record of these funds, not surprisingly, is no better than the market.
15 This is not just true of the stock market. For example, California residents embarked on an orgy of speculation in housing during the 80s, often leveraging themselves to buy two or three rental properties; buying property was a common topic of party conversation. Discouraged and overextended investors sold many of these investments in the early 90s near the bottom of the market.
16 Nothing can “call the top” of a market, but indicator-based strategies that tend to reduce exposure when stocks are highly priced are outlined in Norman G. Fosback, Stock Market Logic: A Sophisticated Approach to Profits on Wall Street, The Institute for Econometric Research, 1986.
17 A succinct article on why most investors should use asset allocation appears in http://www.forbes.com/forbes/98/0615/6112140a.htm. (Forbes, June 15, 1998)
18 See Part 3, Stocks for the Long Run.
19 The Wall Street Journal’s “Robot Blend” is 55% stocks, 35% bonds, and 10% cash.
20 Morgan Stanley & Co. Private Client Services presentation dated June 26,1997.
21 “The Trouble With Asset Allocation,” Fortune, 10/13/97, p. 206
22 For example, until recently covariance between Asian markets and semiconductor stocks was fairly low, while as of this writing it is very high. European and North American markets, meanwhile, are more correlated now than they were a few years ago.
23 After Richard Dawkins’ coinage of meme to mean an idea as a self-perpetuating unit carried on the substrate of human culture, analogous to the gene in reproductive biology.
24 Peter Lynch, who managed Fidelity’s Magellan Fund during its glory years of outperformance, underperformed in his first two years of managing the fund. In today’s climate, he would likely have been fired.
25
26 The “Nifty 50” underperformed the market significantly after the go-go years, but eventually did recover and went on to post better performance than the market as a whole.
27 Forbes 7/28/97, http://www.forbes.com/forbes/97/0728/6002046a.htm
28 Philippe Jorion and William Goetzmann, “A Century of Global Stock Markets,” presented at the 1998 meeting of the Western Finance Association, as reported in The Wall Street Journal, 10/17/97.
29 Taiwan has been an extreme case of a volatile early-stage market. In 1986 the Taiwanese stock index stood at 848; less than four years later in February of 1990 it was at 12,424 and had an average PE ratio over 100. By October 1990 the market had fallen 80% from its peak. Even after this horrendous crash, the market was still three times its level of four years earlier.
30 Jeremy J. Siegel, Stocks for the Long Run: A Guide to Selecting Markets for Long-Term Growth (1994, Irwin Professional Publishing), pp. 133-134.
31 There is a good discussion of index construction in Martin Zweig’s book Winning on Wall Street, Warner Books, 1990, pp. 25-42. A more detailed discussion appears in Norman G. Fosback’s Stock Market Logic: A Sophisticated Approach to Profits on Wall Street, The Institute for Econometric Research, 1986.
32 See http://www.russell.com/.
33 The Wilshire 5000 index was named when it included 5,000 issues, but all issues above a cutoff capitalization are included, so it now includes more.
34 Thomas Easton, “Convergence Theory,” Forbes, July 27,1998; http://www.forbes.com/forbes/98/0727/6202214a.htm. A capitalization-weighted foreign portfolio in late 1989 would have been 49% invested in Japanese stocks, just before the Japanese crash cut their value by 60%.
35 Ibid.
36 “Price to Earnings Growth”, a simple extension of the PE ratio which dviides the PE ratio by the growth rate of earnings in percent. A rough rule of thumb suggests PEGs of less than one represents “growth at a fair price,” though the boundary would have to take into account the level of long-term interest rates and the predictability of future growth to be more than a rough guide.
37 As previously noted, a capitalization-weighted foreign portfolio in late 1989 would have been 49% invested in Japanese stocks, just before the Japanese market crash cut their value by 60%.
38
39 Roger C. Gibson, Asset Allocation: Balancing Financial Risk, Irwin Professional Publishing, 1996. 2 16